Your nature year
Norfolk, Nebraskathrough the year
When do frost, green-up and fall color come to Norfolk?
Spring green-up reaches town around Apr 5, with first blooms around May 5. At the nearest NOAA station, Norfolk 4w, the average first fall frost is Oct 4 and the last spring frost May 1, which leaves Norfolk some 156 growing days.
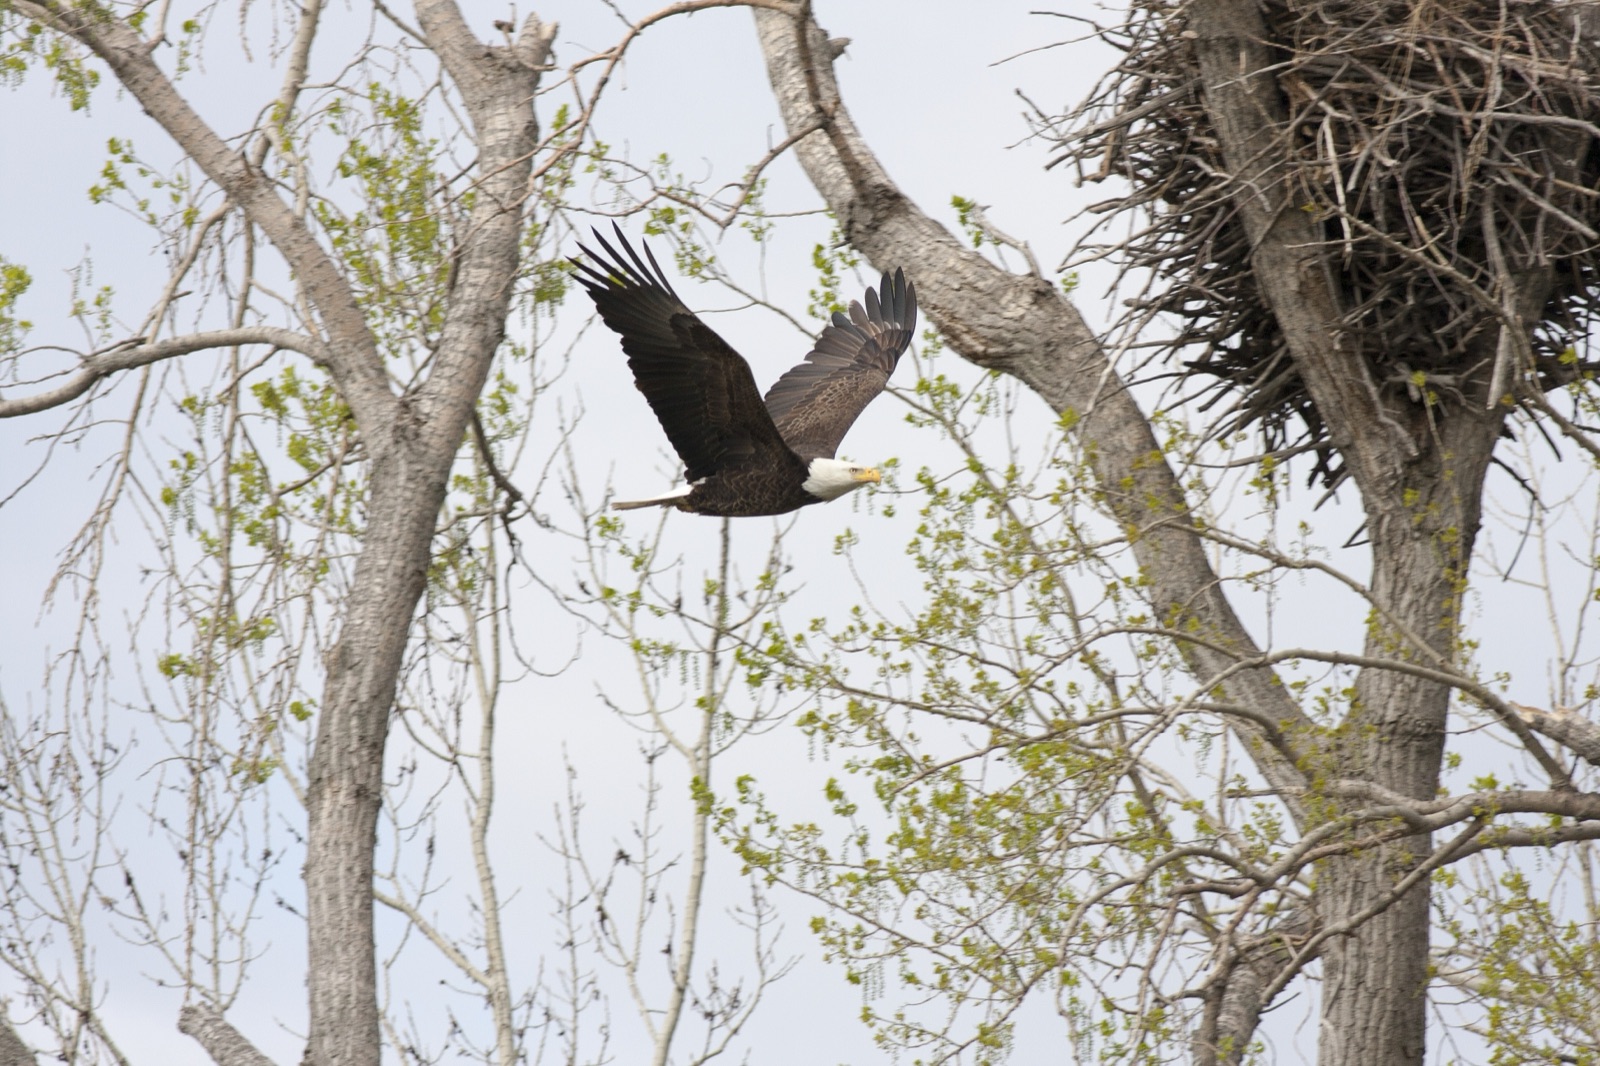
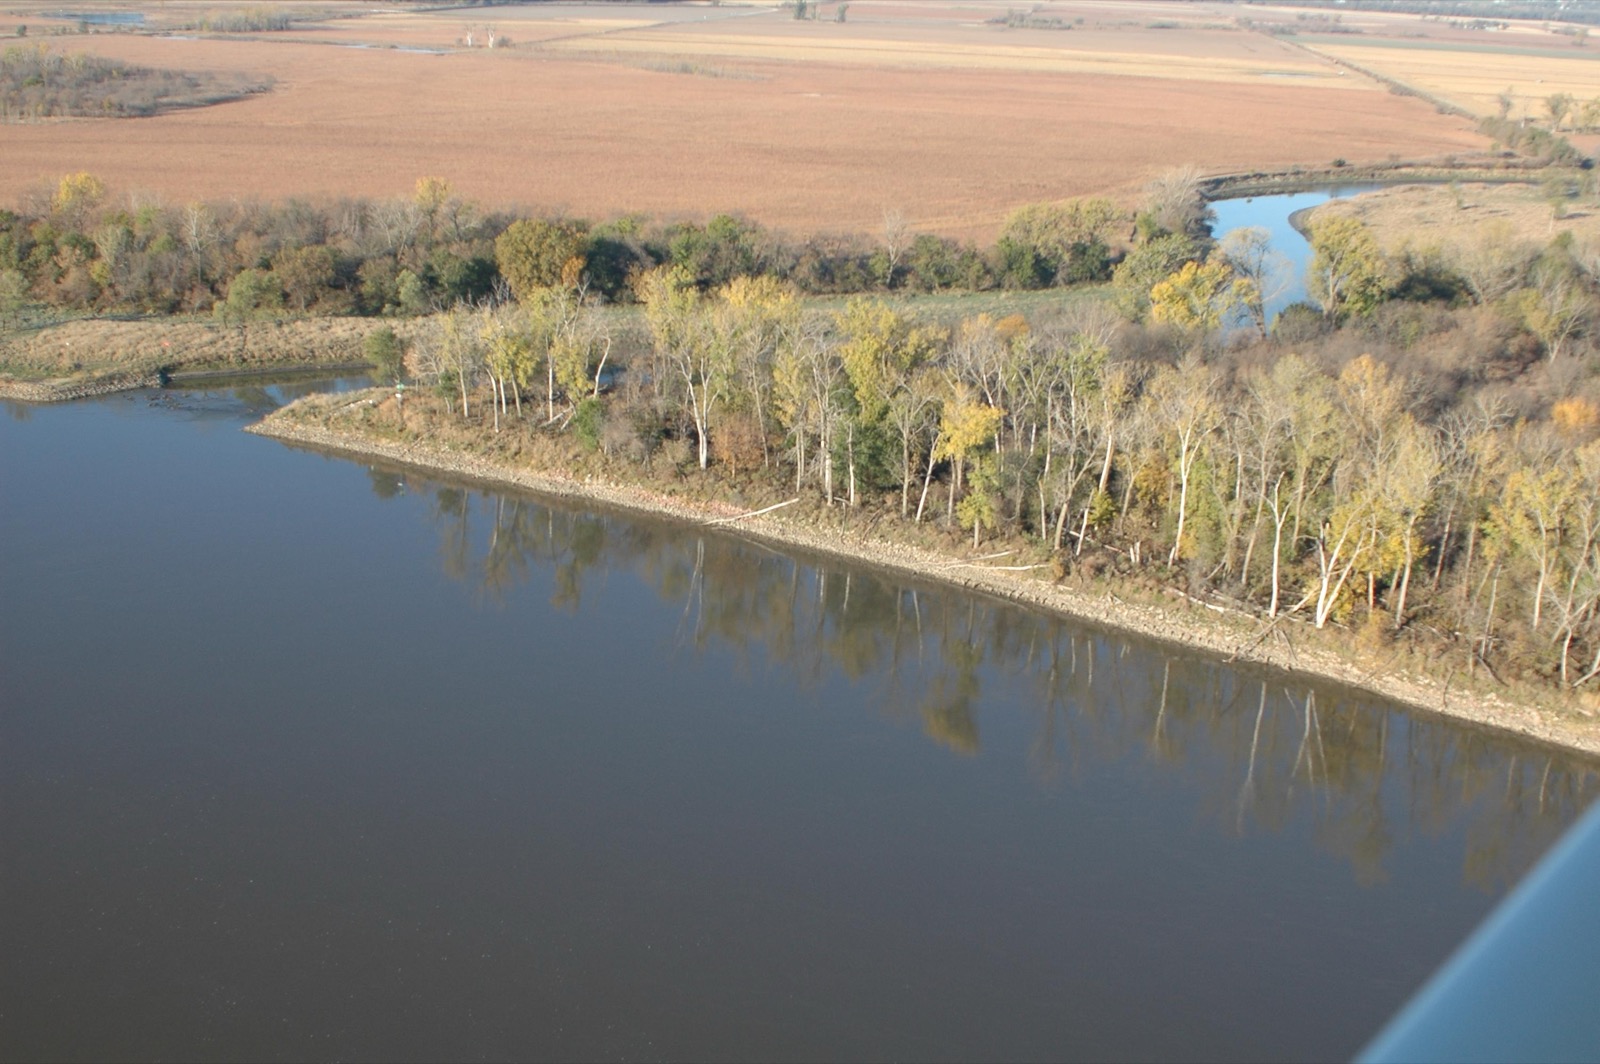
Within 150 miles we follow 3 places, out to Homestead 124 miles to the south. The closest place we follow is DeSoto Refuge, 79 miles away, for fall & winter wildlife, early December, and again in late February and early March (local timing). For spring migration, the nearest is Boyer Chute Refuge (86 mi, In early spring (typically early March) (local timing)).
Checked against 3 official sources · How we check →
Sources: US Census Bureau, 2024 Gazetteer (places) ↗ (opens in a new tab), US Census Bureau, city and town population estimates, 2024 ↗ (opens in a new tab), NOAA NCEI U.S. Climate Normals 1991–2020 (annual/seasonal) ↗ (opens in a new tab)
Near Norfolk right now
- First fall frost usually around Oct 4 · last spring frost around May 1NOAA 1991–2020 normals, Norfolk 4w (3 mi, 50% dates)~1 day
- Fall & winter wildlife · next season nearby · 79 miLocal timing: early December, and again in late February and early March~8 weeks
Places near Norfolk
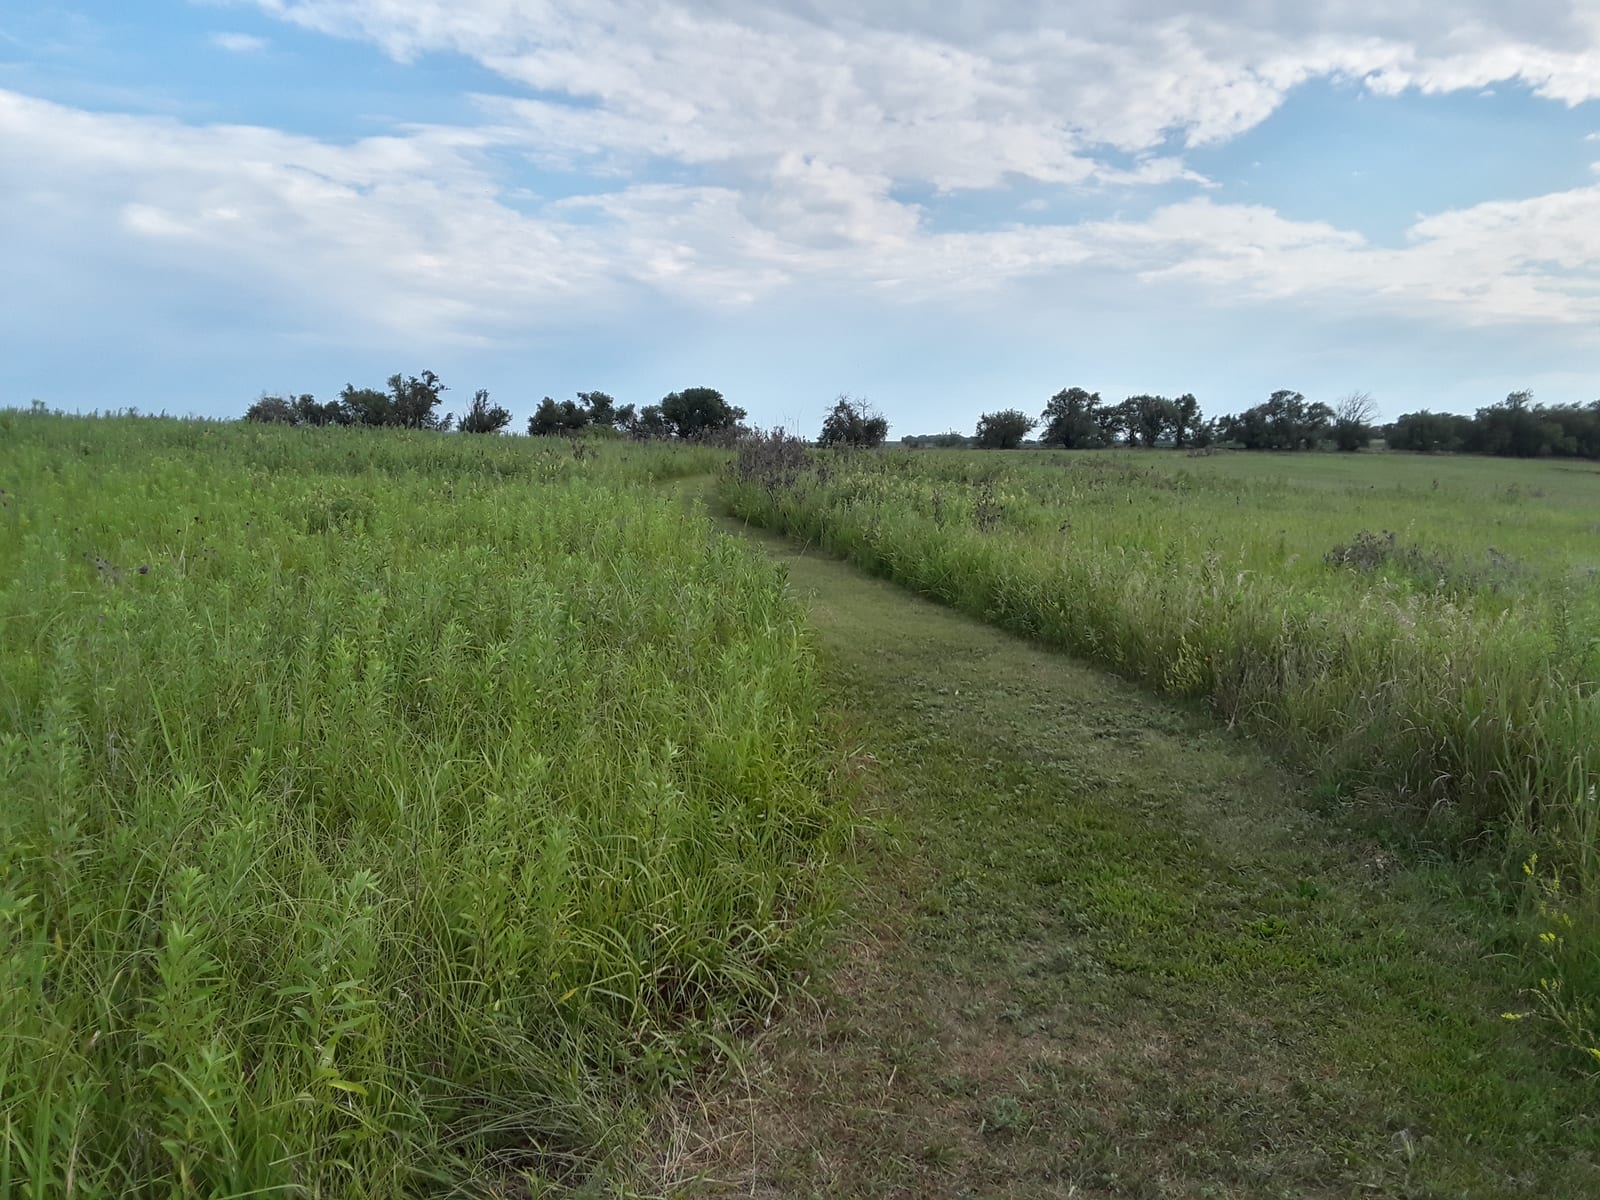
Tallgrass prairie flowers in NebraskaNational Historical Park
124 mi
Season: Late spring to summerNational Park Service ↗
Norfolk's nature year
| Month | What to see | Where |
|---|---|---|
| January–February |
|
|
| March |
|
|
| April |
| |
| May |
|
|
| June–August |
|
|
| October |
| |
| December |
|
|
Norfolk's year at a glance
- Frost possible
- Frost-free, ~May 1 to ~Oct 4
- First leaf ~Apr 5
- First bloom ~May 5
- Today
Frost and green-up
Last spring frost
May 1
Average (50% date)
First fall frost
Oct 4
About 156 days without frost between
Spring green-up
Apr 5
First bloom around May 5
Frost: NOAA 1991–2020 climate normals at Norfolk 4w (3 mi from Norfolk), the day a 32 °F night is as likely as not. Green-up: the USA-NPN Spring Index, 1991–2020 average at the town.
Snow in Norfolk
Snow usually becomes possible around Dec 15 (our calculation from NOAA's daily snow chances: the first day the chance of 0.1" or more of snow reaches 10%). NOAA's normals at Norfolk 4w (3 mi away): 26 inches of snow in an average year, about 9 days with 1 inch or more.
NOAA's chance of at least 0.1 inch of snow on each date (one value per week, September to May), averaged over 1991–2020. A typical year, not a forecast.
Questions people ask
When is the first frost in Norfolk?
On average around Oct 4, and the last spring frost around May 1: about 156 days without frost between. These are NOAA's 1991–2020 normals at Norfolk 4w, 3 miles away (the day a 32 °F night is as likely as not).
When does spring green-up reach Norfolk?
The USA-NPN Spring Index puts first leaf around Apr 5 and first bloom around May 5, on average for 1991–2020 at the town.
Where can I see spring migration near Norfolk?
The nearest is Boyer Chute Refuge (86 miles). Boyer Chute Refuge: local timing: In early spring (typically early March). Distances are straight-line.
Where can I see wildflowers near Norfolk?
The nearest is Homestead (124 miles). Homestead: local timing: late spring to summer. Distances are straight-line.
When does it start snowing in Norfolk?
Snow usually becomes possible around Dec 15. That date is our calculation from NOAA's daily snow chances: the first day the chance of 0.1" or more of snow reaches 10%, at Norfolk 4w. An average year brings 26 inches (NOAA 1991–2020). A typical year, not a forecast.Sources: NOAA NCEI U.S. Climate Normals 1991–2020 (annual/seasonal snowfall) ↗ (opens in a new tab), NOAA NCEI U.S. Climate Normals 1991–2020 (daily snowfall probabilities) ↗ (opens in a new tab)
How we know
US Census Bureau, 2024 Gazetteer (places) (opens in a new tab) (Sep 27) · US Census Bureau, city and town population estimates, 2024 (opens in a new tab) (Sep 27) · NOAA NCEI U.S. Climate Normals 1991–2020 (annual/seasonal) (opens in a new tab) (Sep 27) · USA National Phenology Network, Spring Index 1991–2020 averages (opens in a new tab) (Sep 27)